
How do you know if your community is alive and well? Whether members are active, whether they are using the app, whether your events are catching on, whether you are using the right Socie modules?
All the answers can be found in your Socie Community statistics. The numbers around your community can be a lot of fun and useful! In this blog, we take you through Socie’s dashboard and show you how you can use data to make your community smarter and more vibrant.
📈 Graphs with a story
The power of the Socie dashboard is in the visual representation of usage. Consider:
- Community visits per day/week/month
- Most popular modules (such as events or member list)
- Actions performed by members
Each graph tells a story. For example, are you seeing a spike in sessions around a particular event? Or do you notice that the document module is barely visited? Then you immediately know where your opportunities lie!
🔍 What do you actually see on the Socie dashboard?
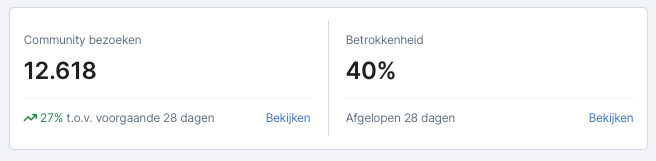
As soon as you open the community management, you immediately notice it. Two large blocks of numbers. We placed these two numbers on the dashboard. This way you can see at lightning speed:
- The number of “Community visits” including growth or decline.
- The “Involvement” of members (What percent of members in the member list are active in the app).
💡 Even more statistics and charts after the click
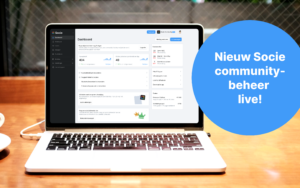
When you click on “view” at the top of the dashboard you are taken into the world of community insights.
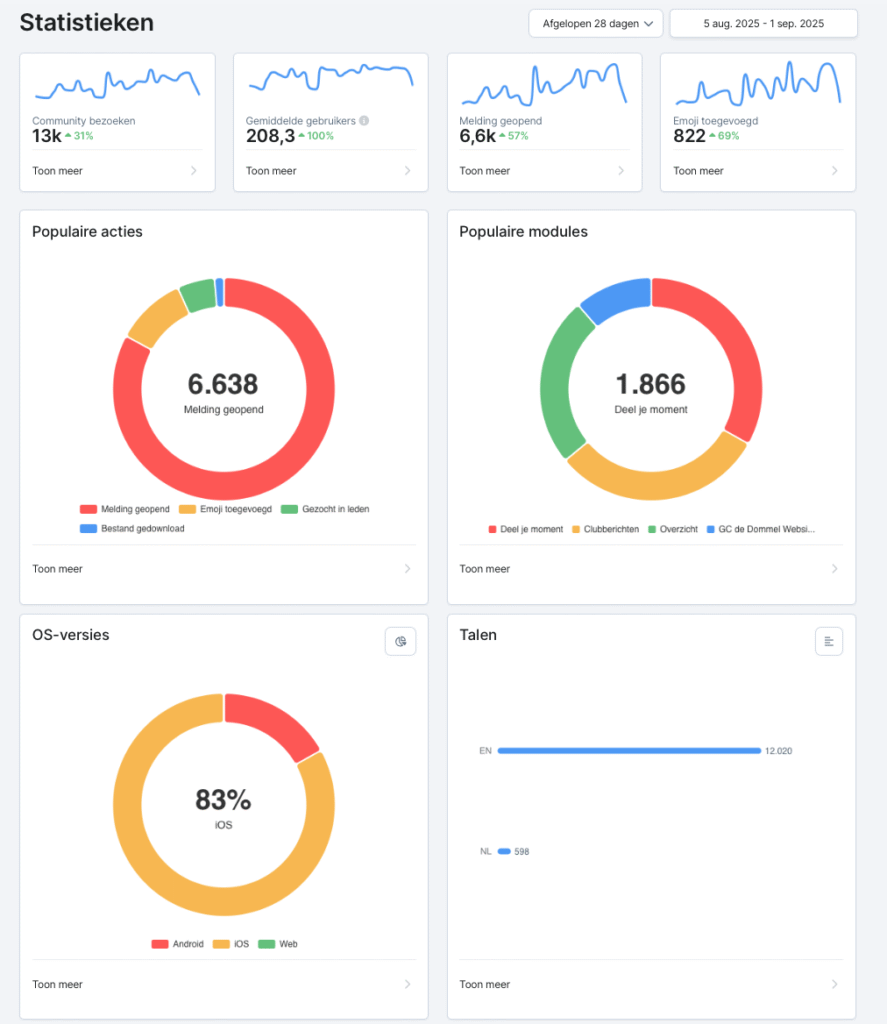
This may seem a bit overwhelming, but these charts actually tell you exactly what you want to know.
For example:
- The number of community visits
- The average number of users
- The number of notifications opened
- The number of emojis added
Below:
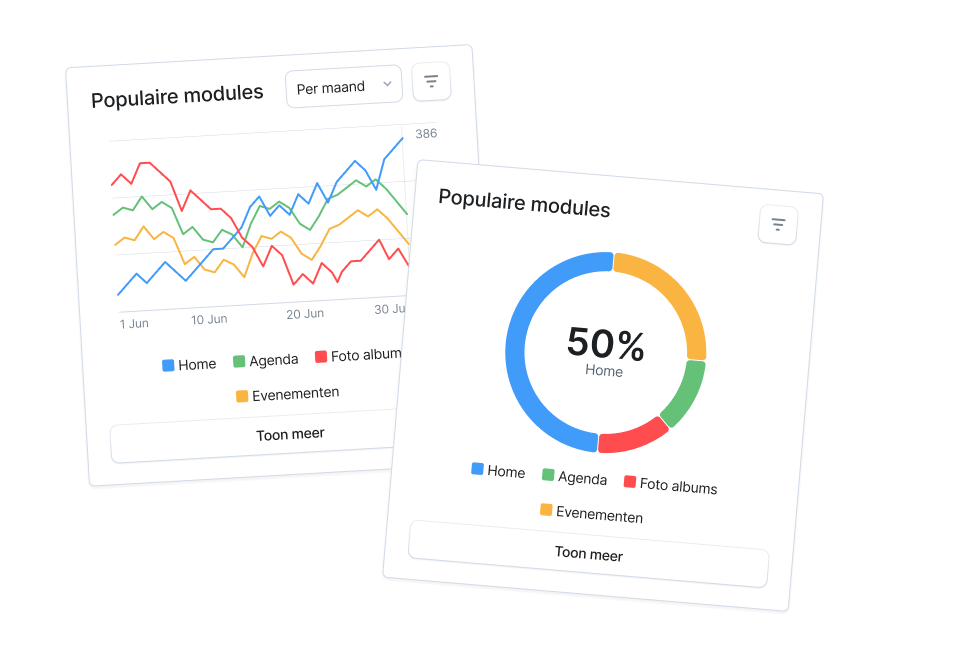
- Popular promotions
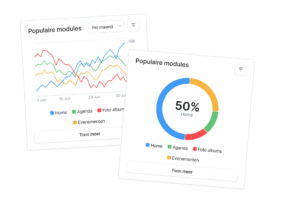
- Popular modules
- What OS versions one uses (Android, ios or web)
- The languages
- and the app versions that your members have
Piece by piece, interesting insights. Because with this kind of data, you can see at a glance whether your community is up to speed.
🔥 But this is not all! , for really all statistics you have to click 1 more time!
Just click on ‘show more’ under 1 of the graphs. Because then you will enter Socie’s statistics hallway. Here you can find everything you want to know about your community. Just click through the tabs! (Community usage, Modules, Actions, OS-Veries, App versions, Languages)
Tip: At the top right, you can compare the statistics with another time period!
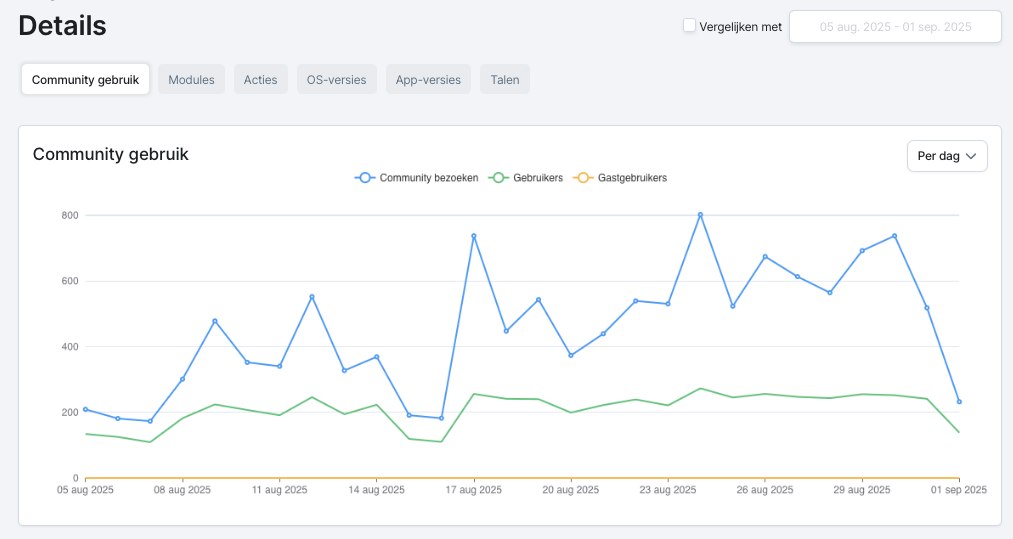
🧐 At the Community usage you immediately see the overview of
-the number of community visits
-the users
-the guest users
This can be shown per day, per week, per month and also a self-selected period.
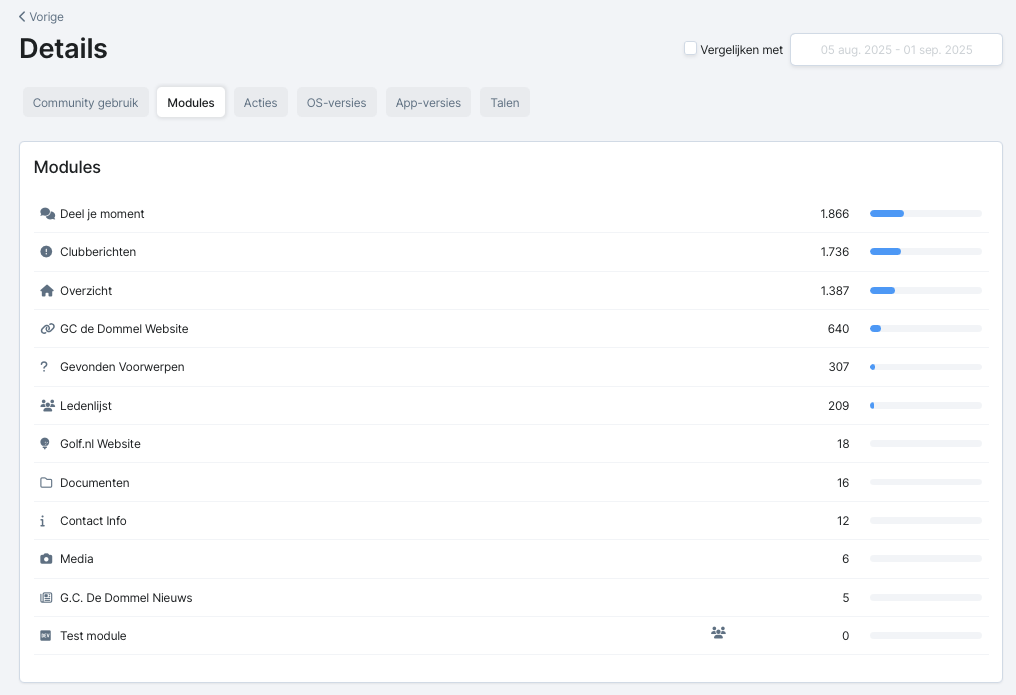
🤳 At the Modules is immediately visible which modules are most consulted. And at the bottom the modules that have been consulted little or not at all. Time for action!
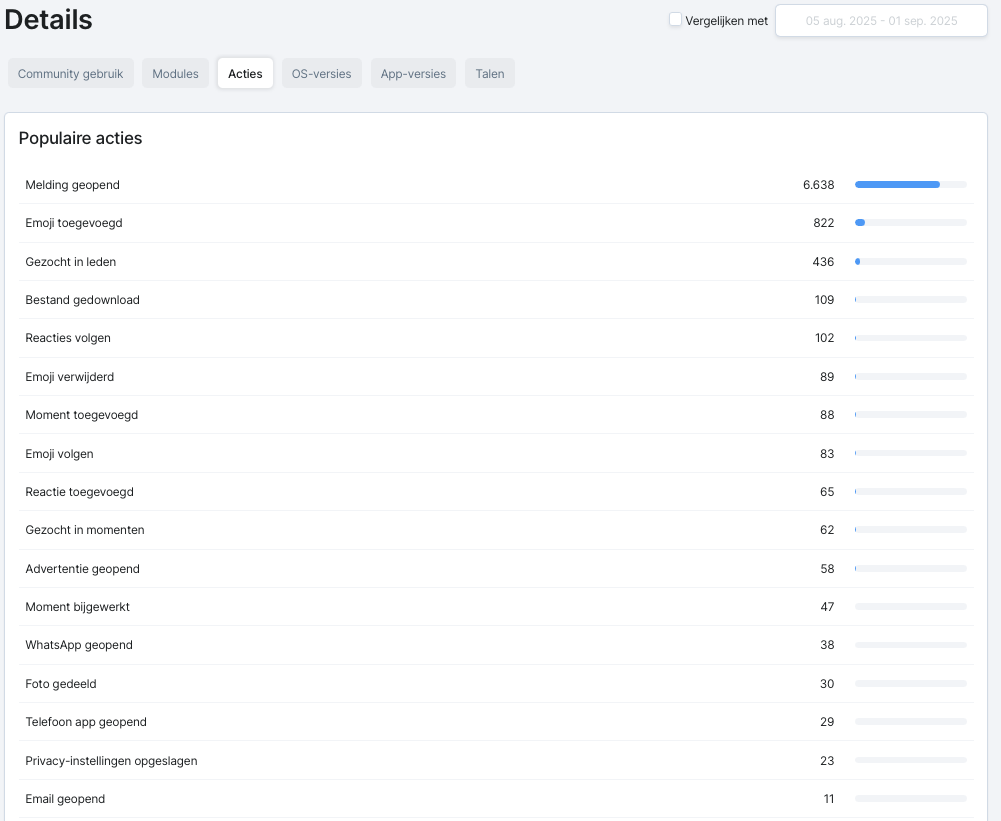
🪄 What exactly do all members do in your community app?
At Popular Actions you will find an overview of which actions have been done.
You can also view OS versions, App versions and the languages used.
In short, there is much to discover!
🎯 F rom insight to action
Statistics are not an end in themselves. They are there to help you make choices. For example:
- Event few entries? Check that members do open the invitation.
- Low engagement on Monday? Try posting on Tuesday with push notification.
Modules that are rarely used? Time to promote them, rethink them or adjust the menu.
So use your statistics dashboard as a compass. Not as a report, but as a guide.
💡 Tips for getting the most out of your statistics
- Compare with previous periods – Have we grown or declined?
- Filter by module or action – This shows you where profits can be made.
Look at unique users – Because 1,000 sessions says less if it’s the same 5 people all the time 😉.
Also curious about how your community is doing? Dive into your Socie dashboard – you’ll be surprised what you can discover there!
Have questions about what you see or how to use it in your strategy? Let us know, we’d love to think with you.